Articles and How-to Tutorials for NGOs
Targeted Groups and Final Beneficiaries
Written by Adel SalahIt is important to clarify that identifying the direct beneficiaries of the project will be possible only after preparing the project logical framework (logframe) and writing all activities, indicators and target number for every indicator and activity. There is a fundamental difference between final beneficiaries of the project and the targeted groups who have a real and direct effect on the beneficiaries.
Targeted groups
Targeted groups are the groups of people that cause the problem. These groups are usually targeted due to their direct effect on the beneficiaries.
For example, teachers, fathers and mothers have a direct impact on students or children; similarly, workers in health facilities have a direct impact on patients.
Beneficiaries are the people affected by the problem and for them, the project is planned and should be funded.
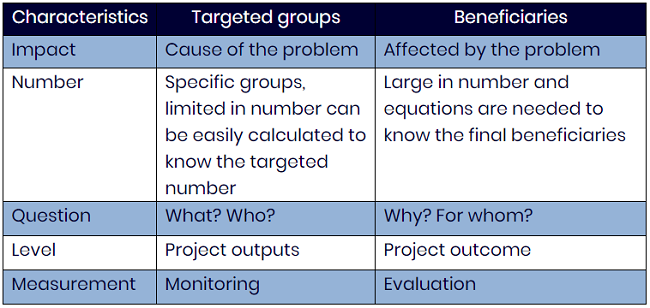
The table above: a comparison between the targeted groups and the final beneficiaries of the project
How to calculate the targeted groups
While writing the project proposal, the targeted groups are calculated in a very easy way. For example in case we want to calculate the number of health service providers we want to train, first we agree on the number of trainings that will be implemented and the number of people in each activity, the total will be the number of trainees of health service providers.
Example:
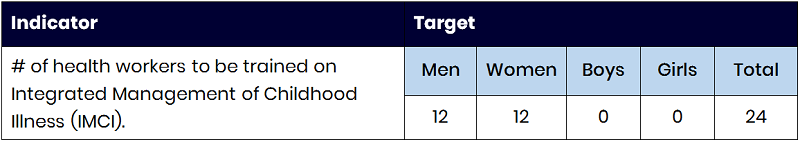
We know that training on Integrated Management of Childhood Illness (IMCI) means to train 24 trainees according the standards of the ministry of health and is followed by all the active organizations like World Health Organization (WHO) and UNICEF. Therefore, if we want to conduct one training course within the project, we will have to target only 24 persons. Then we put into account that the 24 persons will be 12 male health workers of doctors and nurses, 12 female health workers of doctors, nurses and midwives. Therefore, in the logframe we put the indicator and its target as follows:
How to calculate the final beneficiaries of the project?
All donors agreed that beneficiaries’ identification should be based on age and sex in the project proposals and reports issued. In order to calculate the number of beneficiaries in projects that provide services for all people in large numbers, we have to use an equation to calculate the beneficiaries as follows:
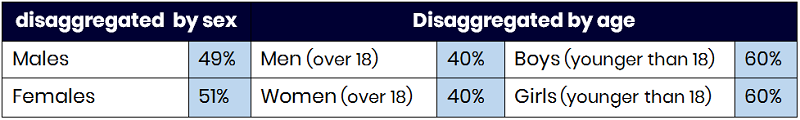
The percentage differs from one country to another according to the general population census and the distribution of people in population pyramid.
Because the donors usually require clear identification of the expected number of final beneficiaries and targeted groups in every project proposal, we will need to learn the methods to calculate these numbers and distribute them in every related activity or indicator as well as in problem assessment, outcome and outputs.
Example:
We will support 10 health facilities that provide primary, maternal and child care, as well as services for 12 months. In order to calculate the expected number of beneficiaries, we do the following:
Assume that every health facility will provide health services for 20 people per day.
Assume that the health facility will work for 22 days a month.
So we have:
The number of beneficiaries (males and females)in a month:
20 people × 22 days= 440 people per month
The number of beneficiaries (males and females) in all targeted health facilities per month:
440 people × 10 facilities= 4400 people in a month in all facilities
The total number of beneficiaries (males and females) in all 10 health facilities in 12 months:
4400 people × 12 months= 52,800 people
Therefore, the total expected number of beneficiaries (Males and females) is 52,800 people.
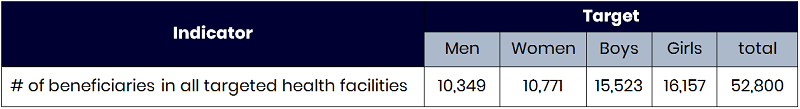
In order for us to put this number in the logframe, we need to disaggregate the number by sex and age into men, women, boys and girls. In this case, we will have to use the equation to distribute the beneficiaries in the example above as the following:
Number of men= total number of beneficiaries × male percentage × over 18 years percentage
52,800 × 0.49 × 0.40= 10,349
Number of women= total number of beneficiaries × female percentage × over 18 years percentage
52,800 × 0.51 × 0.40= 10,771
Number of boys= total number of beneficiaries × male percentage × under 18 years percentage
52,800 × 0.49 × 0.60= 15,523
Number of girls= total number of beneficiaries × female percentage × under 18 years percentage
52800 × 0.51 × 0.60= 16,157
So, we put the indicator in the logframe as follows:
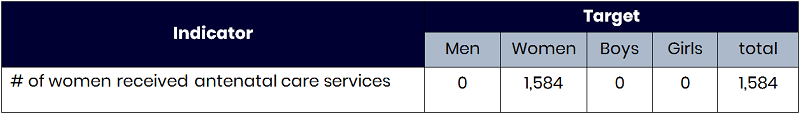
In case you are planning to implement an activity that targets pregnant women like providing antenatal care services within the same targeted health facilities, you will need to identify the number of pregnant women who will be provided antenatal services in the targeted areas and they are actually part of the total number calculated in the above example (52,800)
To identify the expected number of pregnant women who will benefit from the antenatal services, we do the following:
Assume that the annual growth rate of the population in the country = 3% every year (every 12 months)
This means in 12 months during which antenatal services will be provided, the percentage of pregnant women= 3% of the total number of beneficiaries.
So the equation we use to calculate number pregnant women, who will get antenatal care services is:
Number of pregnant women= total number of beneficiaries * 0.03
52800 × 0.03= 1,584
So we put the indicator in the logframe as follows:
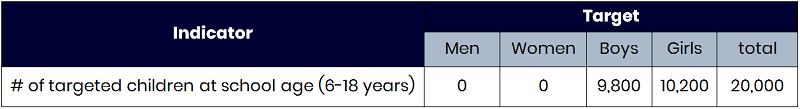
In case the project is on education sector and we want to implement activities for children at school age (6-18 years), we expect that this age group usually represent at least 20% of the total targeted population. If the total number of population targeted areas is 100,000 people, it means that:
Children at school age = total number of beneficiaries * 0.20
100,000 × 0.20= 20,000
By using the percentage of males and females in the table of beneficiaries’ calculation equation, we will be able to get the number of boys and girls.
Girls at school age
= total number of beneficiaries * Percentage of female.
20,000 × 0.51= 10,200
Boys at school age = total number of beneficiaries * Percentage of male.
20,000 × 0.49 = 9,800
So, we but the indicator in the logframe as follows:
Thus, we put an estimated number of the beneficiaries for all project indicators by having the percentage of the beneficiaries disaggregated by sex and age group based on population census of the country, in which the project will be implemented.
To know the total expected number of the beneficiaries (males & females) in the project we use the Beneficiaries Calculation Sheet, then copy all the indicators of the project to this Sheet. We will need to decide which a single count indicator is in case it showed up once. While if the same beneficiaries are getting more than one service or assistant, this means that these people or part of them is repeated in other indicators. That is why we need to take into consideration that it is a double count.
For all that, we had to develop the beneficiary Calculation sheet in order to come up with the total single count number of beneficiaries.
In case the total number of one of the indicators is the highest figure and at the same time it covers the same people in the other indicators, we generally consider it the total number of beneficiaries, then we divide the beneficiaries only according to this number. Please see the form to calculate beneficiaries in the next table to know how to identify the number of beneficiaries clearly with all related notes.
Portal365 allows you to do that with ease. Give it a try and start your free trial now.